Sunday, November 7, 2010


LESSON 5:  DEMAND AND ITS DETERMINANTS
Focus Question: What factors affect demand in a market economy?

Objectives
Students will be able to:
  • Explain the law of demand.
  • Create and interpret demand charts.
  • Discuss the factors that change demand.
  • Explain the difference between movement along and shifting of the demand curve. 
___________________________________________________________________________________


    Teaching Strategies
    I.      The Law of Demand
    • Begin the lesson by asking for the economists’ definition of demand.

    Demand is the desire to purchase a particular item at a specified price and time, by consumers who are willing and able to buy.

    • Explain that there is a Law of Demand which states that quantity demanded varies inversely with changes in price. When all other things are equal, buyers will purchase more of an item at a lower price and less at a higher price. Elicit reasons why this is so


    The relationship between the price of a good and the quantity consumers will demand can be expressed as a demand schedule and as a demand curve.

    • Distribute and have the students complete worksheet 5A; have them confirm their understanding of the Law of Demand by answering the following questions:
      • What happens to the quantity demanded as the price goes up?
      • What happens to the quantity demanded as the prices goes down?
      • Describe the slope of the demand curve: is it positive or negative?
      • Describe the relationship between price and quantity demanded: is it direct or inverse?

    When economists refer to the quantity demanded, they refer to a specific point along the demand curve. A change in the quantity demanded is a result of change in the price of a good and is shown as a movement along the demand curve.  
    ______________________________________________________________________________________________

    II. Determinants of Demand
     
    • Explain that to economists, an increase or decrease in quantity demanded has a different meaning than an increase or decrease in demand.

    An increase or decrease in the quantity demanded is shown as movement along the demand curve, an increase or decrease in demand is shown by a shift in the demand curve. A change in the demand of a good or service is caused by something other than a change in the price of a good or service.

    • Distribute and have the students complete worksheet 5B and then answer the following questions:
      • When the demand curve shifts upward and to the right, is this indicative of an increase or decrease in demand?
      • When the demand curve shifts downward and to the left, is this indicative of an increase or decrease in demand?
      • Why does the demand curve shift?
    • Distribute worksheet 5C and group the students into teams of 3, 4 or 5; have each team complete the worksheet (complete the table) and be prepared to share the results. Record the responses into tables on the board.
      • Provide an opportunity for students to identify any determinants that have not been listed.  
      • Have the students confirm direction the demand curve will move for each determinant. 


    • Use the table below to confirm students’ comprehension of the distinction of movement along the curve or a shift in the demand curve by indicating whether each scenario results in a change in the quantity demanded (movement along the demand curve), or a change in demand (shift in the demand curve). If there is a shift in the demand curve, indicate whether the curve shifts up or down.
     
    ______________________________________________________________ 

    III. Price Elasticity of Demand

    • Although the Law of Demand tells us that fewer items are bought at higher prices than lower prices, it does not tell by how much the quantity demanded will increase or decrease at different prices.

    Price Elasticity describes the percentage change in demand – as measured by the dollar value of spending for an item – that follows a price change. The more demand expands or contracts after a price change, the greater the price elasticity of demand.
      • Demand is price elastic when the percentage change in quantity demanded is greater than the percentage change in price.
      • Demand is price inelastic when the percentage change in price is greater than the percentage change in quantity demanded.
      • Demand is unit elastic when the percentage change in price is exactly equal to the percentage change in quantity demanded
    • Ask students to identify factors that tend to affect price elasticity of demand for a product or service. List each factor in a table (like the one below) and then have the class explain how the factor affects elasticity.

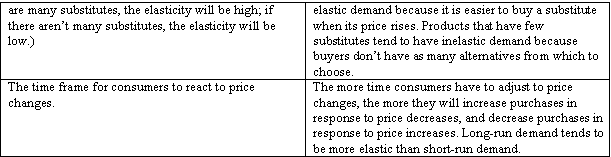


    • Explain how price elasticity can be measured. (Write these formulas on the board leaving them up for students to refer as they work on worksheet 5D.)
      • The Total Revenue Test
    The total revenue test measures the revenues that a firm receives at different price levels. Total revenue is based on the following formula:
    Total Revenue = Price * Quantity
    If total revenue increases after the price of a product drops, then demand for that product is considered to be elastic. Revenues increase for that good or service by a greater percentage than the percentage change in price. (The seller makes less on each sale, but sells enough additional units to make up for the lower price.)

    If total revenue decreases after the price of a product decreases, then demand for that product is considered to be inelastic. When a decrease in price has resulted in only a small increase in quantity demanded, and the change in quantity demanded is less than the change in price, total revenue will decrease.
    o        Price Elasticity of Demand Formula (PEoD)

    PEoD = (% change in quantity demanded/% change in price)

    To calculate the price elasticity, you first calculate the percentage change in quantity demanded and the percentage change in price.

    The higher the price elasticity, the more sensitive consumers are to price changes. High price elasticity suggests that when the price of a good goes up, consumers will buy less and when the price of a good goes down, consumers will buy more. Low price elasticity implies the opposite, that changes in prices have little impact on demand.

    • Distribute Worksheet 5D; have the students complete the activities and share their results with the class.

    Summary:

    • The accounting manager of your VE firm advocates a cost-based pricing strategy in which the company will price products by starting with the wholesale cost and then adding a markup to provide a profit. What factors, besides the wholesale cost of the product, should be considered when determining the selling price of products?
    • How do business managers use information about demand, demand determinants and price elasticity of the company’s products to make pricing decisions? Explain.

      Friday, November 5, 2010

      LESSON 6: SUPPLY AND PRICE DETERMINATION

      Focus Question: How do the forces of supply and demand determine the price of goods and services in our economy?

      Objectives
      Students will be able to:
      • Explain the law of supply.
      • Create and interpret supply charts.
      • Discuss the factors that change supply.
      • Explain and depict on a chart a shift in supply.
      • Explain how the interaction of supply and demand results in an equilibrium price.

      Standards
      NES: 1, 7, 8, 9, 13
      ELA: 1, 2, 3

      Materials
      Text, Chapter 7, pp. 186-201.

      Teaching Strategies
              I.      The Law of  Supply
      • Tell the class that you would like them to take part in an experiment asking for their opinion about an opportunity to work part time, before or after school, in the school library.
        • You will ask the students to decide how many hours per week they would like to work, up to a maximum 25 hours per week at various rates of pay.
        • Have each student in the class complete exercise 1 in worksheet 6A. Once they have completed the survey, record the responses of five students on the chalkboard in a table like the one below. 

                        
      Hourly rate
      Student #1
      Student #2
      Student #3
      Student #4
      Student #5
      Total hours students are willing to work
      $30


      $25


      $20


      $15


      $10


      $7


      $5


      $3


      $2


      $1


      • Once the students’ responses have been entered into the table, ask the following questions:
      1.      Do you see a pattern to the students’ responses?
      2.      Why does a higher wage generally increase the students’ willingness to work?
      3.      What factors, besides the hourly wage rate, would influence a student’s choice to work or not?
      4.      Would you expect that all people would respond the same way to this offer? Explain.
      5.      Ask the students to identify the economic concept illustrated by this activity. (Supply)
      6.      Ask if anyone can provide the economists’ definition of supply. (Economists use the term supply to describe the quantity of goods and services that will be offered for sale at a given price.)
      7.      Ask if anyone can explain the Law of Supply. (The quantity of a good or service supplied varies directly with its price. The number of units of something offered for sale increases as the price increases and the number of units offered for sale decreases as the price decreases.)
      8.      Elicit reasons why this is so. (The incentive of higher profits: Existing producers will increase their output at higher prices to maximize revenue. New producers will be lured into the market by the higher prices.)

             I.      The Supply Curve
      • Have the students complete worksheet 6B and confirm their understanding of the Law of Supply by answering the following questions:
      1.      What happens to the quantity supplied as the price goes up?
      2.      What happens to the quantity supplied as the price goes down?
      3.      Describe the slope of the supply curve: is it positive or negative?
      4.      Describe the relationship between price and quantity supplied: is it direct (price and quantity move in the same direction) or inverse (price and quantity move in opposite directions)?
      When economists refer to the quantity supplied, they refer to a specific point along the supply curve. A change in the quantity supplied is a result of change in the price of a good and is shown as a movement along the supply curve. 

          II.      Determinants of Supply
      • We have seen that as the price of a good or service changes, the quantity that producers are willing to supply changes. (A change in the quantity supplied.)
      • There are some factors however that result in a shift in the supply curve.

      When economists refer to supply, they refer to the amount of goods or services offered at all price levels represented by a supply curve. A change in supply is a shift of the entire supply curve. A change in supply of a good or service is caused by something other than a change in the price of a good or service.

      · Have the students complete exercise 1 on worksheet 6C. Once they have finished the worksheet,        present the following questions to the class:
             1.      What was the cause of the increase in supply (Why did the supply curve shift to the right)? 2.      Can you name any other factors that would result in a shift in the supply curve? (There are four major determinants of supply: price of inputs, number of firms in the industry, taxes, technology).
      ·         Direct the students’ attention to exercise 2 on Worksheet 6C which lists the determinants of supply. Lead a discussion with the students explaining how each of the determinants affects supply. Have the students record the results of the discussion by completing the table (provide examples when possible).

      Determinant of supply
      Affect on supply
      Explanation
      A change in the price of inputs (raw materials, wages, etc.)

      A decrease in the price of inputs.
      Increase (supply curve shifts to the right)
      If the price of inputs decreases, production costs will be lower so producers will be willing to supply more at  all price levels. Ex: when the price of memory chips fell, computer manufacturers were willing to supply more at any given price than before.

      An increase in the price of inputs.
      Decrease (supply curve shifts to the left)
      If the price of inputs increases, production costs will be higher so producers offer fewer products for sale at all price levels.  Ex.  If labor costs rise, producers will not be willing to produce as many units.
      A change in the number of firms in the industry.
      Increase in the number of firms in the industry
      Increase (supply curve shifts to the right)
      As more firms enter an industry, there are greater quantities supplied at every price.
      Decrease in the number of firms
      Decrease (supply curve shifts to the left)
      As businesses leave the market, fewer products are offered for sale at every price.  Ex.  A neighborhood dry cleaner closes (decrease in the number of firms) and a deli opens up in its place (increase in the number of firms).
      A change in taxes
      Increase in taxes
      Decrease (supply curve shifts to the left)
      If higher taxes are imposed, businesses will react as if production costs have risen, and will not be willing to supply as much as before.
      Decrease in taxes
      Increase (supply curve shifts to the right)
      A decrease in taxes is seen as a decrease in production costs, and, therefore, businesses will be willing to supply more at every price.
      Technology development

      Increase (supply curve shifts to the right)
      The use of science to develop new products and new methods of production usually reduces the cost of production.


       IV. Supply, Demand and the Market Price
      You have learned that the Law of Demand that tells us that consumers will tend to buy less of a good or service at higher prices and more of a good or service at lower prices, and that the Law of Supply tells us that suppliers will tend to produce more of a good or service at higher prices and less at lower prices.
      But how are prices determined in a market economy? Adam Smith explained in the Wealth of Nations, that the optimal economics decisions will be made when buyers and sellers are free to interact, guided by their own self-interest. The prices of goods and services are the result of interactions between people who are willing to buy and people willing to sell. The interactions between voluntary buyers and sellers results in an equilibrium price at which the quantity demanded equals the quantity supplied. In this way, supply and demand determine the final price of a product.

      How does this work?

      Have the students complete exercises 1 and 2 in worksheet 6D and answer the following questions:

      Why does the price decrease if it is above equilibrium?

      Why does the price increase if it is below equilibrium?

      What are possible events that would result in a change in the equilibrium price? 


      Summary/Assessment:

      •      In New York City rent control limits the amount that landlords are able to raise some tenants’ rents. Based on your understanding of the laws of supply and demand, explain the effect of rent control legislation on the rental market in New York City. Use a chart depicting supply and demand curves to support your explanation.

      •     The U.S. Congress has passed minimum wage legislation the mandates that all workers be paid at least a specified hourly wage. While supporters of the minimum wage argue that it protects low paid workers from being abused by employers who may otherwise pay wages that are too low to live on, detractors claim that a minimum wage results in higher unemployment among lower paid workers. Based on your understanding of the laws of supply and demand, explain how minimum wage laws affect the market for low wage workers. Use a chart depicting supply and demand curves to support your explanation. 

      Cafe Impressa Business Plan Assignments

      Click HERE to view the CAFE IMPRESA BUSINESS PLAN 2010 - 2011
      https://docs.google.com/document/edit?id=1EVx3VTNUS6b1sKA69xnPv23gtbR53NpKwqhvBOXZM5o&hl=en


      Log in to your GMail account and click on Documents to Edit . .

      To see last year's CAFE IMPRESA BUSINESS PLAN, click HERE:
      http://dl.dropbox.com/u/5046837/Cafe%20Impresa/Cafe%20Impresa%20Business%20Plan%202009-2010%20Final%20Copy.pdf

      http://dwcvirtualenterprise.blogspot.com/2010/05/important-information-for-financial.html.


      Of Particular importance is the FINANCIAL STATEMENT WORKSHEET.  Ask Geeta or Ruth to EDIT.
      http://spreadsheets.google.com/ccc?key=0AjLIWVqScyXfdEh4M0FYZVdmck1tNFM2cDlOVnBWM2c&hl=en

      CAFE IMPRESA WRITTEN BUSINESS PLAN 2010 - 2011 ASSIGNMENTS


      Cover Design - Rodney Taylor

      CEO Letter - Ruth Perez

      Table of Contents

      --------------------------------------------------------------

      INTRODUCTORY CONTENT - Ruth Perez

      Statements of Purpose - Ruth Perez

      Mission Statement - Ruth Perez

      Business Objectives - Ruth Perez

      Company Description - Ruth Perez

      Current Status - Natasha Pereira

      Future Goals - Natasha Pereira

      Description of Staffing - Marjoan Baldera, Saqlain Qazalbash

      Organizational Chart - Yasmin Christian, Diana Zaro Aquino

      --------------------------------------------------------------

      MARKET ANALYSIS

      Real World Industry Analysis - Oscar Marrero, Jhevar Allen

      Virtual Enterprise Industry Analysis - Franklin Mercedes, Stephen Ampofo

      Short Term Plan, Long Term Plan - Anibal Barroso, Stefano Dawkins

      Components of the Marketing Mix (5 P's) - Rosanna Moquette, Malachi Lawrence

      Direct Promotion, Indirect Promotion - Shamara Overton, Jhane Miller

      Target Market - Mike Nunez, Hansel Ramirez

      Geographic, Demographic, Psychographic - Tennessee Martin, Jevaun lee

      Market Segmentation -

      Age, Income, Product Type - Mike Nunez, Hansel Ramirez

      Geography, Buying Patterns, Customer Needs - Alexander Inoa, Daniel Eusebio

      -----------------------------------------------------------

      SWOT ANALYSIS - Crystal Nunez, Emmanuel Mercedes

      Internal Audit - Crystal Nunez, Emmanuel Mercedes

      External Audit - Crystal Nunez, Emmanuel Mercedes

      Discussion of Business Risk - Frankely Espinal

      -------------------------------------------------------------

      OPERATING PROCEDURES - Rocio Aponte, Jessica Silveira

      Location - Rocio Aponte, Jessica Silveira

      Process - Rocio Aponte, Jessica Silveira

      ---------------------------------------------------------------

      FINANCIAL DATA

      Fixed Costs - Lica Cisse, Teriq James, Bryan Torres

      Balance Sheet  - Lica Cisse, JonCarlos De La Cruz


      3 year projected income statement - Lica Cisse, JonCarlos De La Cruz

      1 year projected cash flow statement - David Nimako, Tykeem Williams

      Break Even Analysis - Zainab Lakhi

      Explanation of Financials - Lica Cisse, JonCarlos De La Cruz

      ------------------------------------------------------------------------------------------

      Allen,Jhevar -Real World Industry Analysis
      Ampofo,Stephen- Virtual Enterprise Industry Analysis
      Aponte,Rocio-OPERATING PROCEDURES
      Baldera,Marjoan- Description of Staffing
      Barroso, Anibal-Short Term Plan, Long Term Plan
      Cisse,Lica-Explanation of Financials, Fixed Costs, Balance Sheet, 3 year projected income statement
      Cristian, Yasmin-Organizational Chart
      Dawkins,Stefano- Short Term Plan, Long Term Plan
      De La Cruz, Joncarlos- Explanation of Financials, Balance Sheet, 3 year projected income statement
      Espinal, Frankely-Discussion of Business Risk
      Eusebio, Daniel- Geography, Buying Patterns, Customer Needs
      Inoa, Alexander- Geography, Buying Patterns, Customer Needs
      James, Teriq- Fixed Costs
      Lakhi, Zainab-Break Even Analysis
      Lawrence,Malachi- Components of the Marketing Mix (5 P's)
      Lee, Jevaun- Geographic, Demographic, Psychographic
      Marrero, Oscar- Real World Industry Analysis
      Martin Tennesee- Geographic, Demographic, Psychographic
      Mercedes, Emmanuel- SWOT ANALYSIS
      Mercedes, Franklin-Virtual Enterprise Industry Analysis
      Miller, Jhane- Direct Promotion, Indirect Promotion
      Moquete, Rosanna- Components of the Marketing Mix (5 P's)
      Nimako, David- 1 year projected cash flow statement
      Nunez, Crystal- SWOT ANALYSIS
      Nunez, Mike- Target Market Age, Income, Product Type
      Overton, Shamara- Direct Promotion, Indirect Promotion
      Pereira, Natasha- Current Status, Future Goals
      Perez, Ruth- CEO Letter, INTRODUCTORY CONTENT
      Qazalbash, Saqlain- Description of Staffing
      Ramirez, Hansel- Target Market, Age, Income, Product Type
      Silveira, Jessica- OPERATING PROCEDURES
      Taylor, Rodney- Cover Design
      Torres, Bryan- Fixed Costs
      Williams, Tykeem- 1 year projected cash flow statement
      Zaro Aquino, Diana- Organizational Chart

      Thursday, November 4, 2010

      Skype Meeting cancelled for today Thursday Nov 4, 2010

      Hello Business Plan Team,

      EURO needed to cancel our Skype meeting for today.

      Survey for all members of the Cafe Impresa & Carpe Diem Advertising business plan teams to complete.

      http://www.surveymonkey.com/s/XLYGJ92