Tuesday, November 30, 2010

LESSON 11: STABILIZING THE NATIONAL ECONOMY

Focus Question: Why is it important for the economy to be balanced, or stabilized?


Objectives
Students will be able to:
• Discuss how the government measures unemployment.
• Describe the types of unemployment.
• Understand the causes of inflation.
• Analyze how inflation affects individual and business decisions.
• Discuss how the government uses fiscal policy to stabilize the economy.


Standards
NES: 18, 19, 20
ELA: 1, 3

Time Frame/Notes to Teacher
One day, double period


Materials
Textbook chapter on “Unemployment and Inflation.”


Teaching Strategies
I. Review homework on CPI and unemployment figures. Ask the following questions:
• From your study of economic indicators, in what direction do you think the economy is going?
• Do you think government should attempt to modify this direction? Why or why not?

II. Unemployment
Distribute Worksheet 11A, “How the Government Measures Unemployment.” Divide the class into
four groups and have them complete the exercise. Then have each group report back to the class on
one type of unemployment. Ask the following questions:
— What jobs and industries are prone to one or more types of unemployment?
— Is there any way to eliminate or ease the conditions that cause unemployment?

III. Inflation

Distribute Worksheet 11B, “Understanding Inflation.” Discuss the changes in spending and investing
that individuals and businesses make during a period of inflation. Ask the following:
— What type of hardship would rapidly rising prices place on a supermarket?
— How would a retiree on a fixed income fare during a period of inflation?
— What effect would inflation have on a business contractor?
— Would individuals’ savings change in value during inflation?
— How would inflation affect mortgage lenders?
— On the whole, would you say that the people you know are doing well in this economy?
— According to the data, what are the best jobs and industries to enter now?

IV. Stabilizing the National Economy


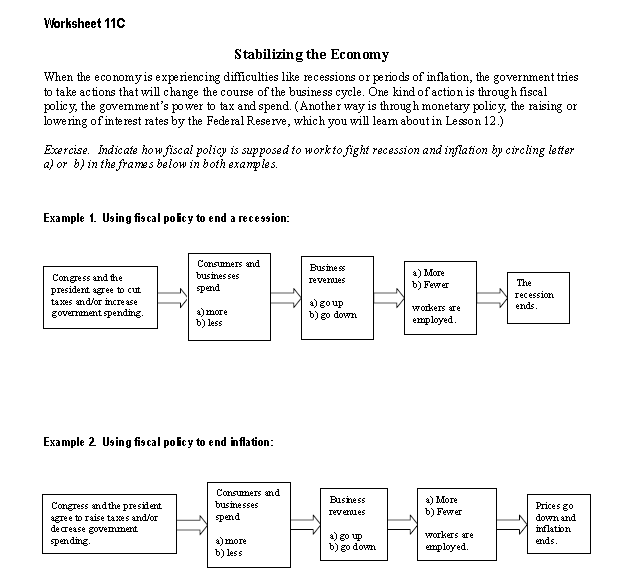
Distribute Worksheet 11C, “Stabilizing the National Economy.” Have students complete the exercise


on the worksheet. Then have them explain their answers to the following:
— In your own words, what is fiscal policy?
— How do the charts show how fiscal policy is supposed to work to fight recession? How do the
charts show how fiscal policy is supposed to work to fight inflation?
— How can you explain that sometimes fiscal policy does not work or takes a long time to work?

Summary/Assessment
If we were to enter a period of recession, what would likely happen to the unemployment rate? The
inflation rate? The poverty rate? Explain your answer.

Homework
• Read materials in preparation for the next lesson.
• Assign questions for homework.

________________________________________________________

Worksheet 11A

How the Government Measures Unemployment

When workers are unemployed, they, their families and the country as a whole lose. Workers and their
families lose wages, and the country loses the goods or services that could have been produced. In
addition, the purchasing power of these workers is lost, which can lead to unemployment for yet other
workers.

To know about unemployment—the extent and nature of the problem—requires information. How many
people are unemployed? How did they become unemployed? How long have they been unemployed? Are
their numbers growing or declining? Are they men or women? Are they young or old? Are they white or
black or of Hispanic origin? Are they skilled or unskilled? Are they the sole support of their families, or
do other family members have jobs? Are they more concentrated in one area of the country than another?
After these statistics are obtained, they have to be interpreted properly so they can be used—together with
other economic data—by policymakers in making decisions as to whether measures should be taken to
influence the future course of the economy or to aid those affected by joblessness.

WHERE DO THE STATISTICS COME FROM?

Early each month, the Bureau of Labor Statistics (BLS) of the U.S. Department of Labor announces the
total number of employed and unemployed persons in the United States for the previous month, along
with many characteristics of such persons. These figures, particularly the unemployment rate—which tells
you the percent of the labor force that is unemployed—receive wide coverage in the press, on radio, and
on television.

Because unemployment insurance records relate only to persons who have applied for such benefits, and
since it is impractical to actually count every unemployed person each month, the Government conducts a
monthly sample survey called the Current Population Survey (CPS) to measure the extent of
unemployment in the country. There are about 60,000 households in the sample for this survey. The
sample is selected so as to be representative of the entire population of the United States.

WHAT ARE THE BASIC CONCEPTS OF EMPLOYMENT AND UNEMPLOYMENT?
The basic concepts involved in identifying the employed and unemployed are quite simple:
• People with jobs are employed.
• People who are jobless, looking for jobs, and available for work are unemployed.
• People who are neither employed nor unemployed are not in the labor force

Employed persons consist of:
• All persons who did any work for pay or profit during the survey week.
• All persons who did at least 15 hours of unpaid work in a family-operated enterprise.
• All persons who were temporarily absent from their regular jobs because of illness, vacation, bad
weather, industrial dispute, or various personal reasons, whether or not they were paid for the time
off.

Unemployed persons are:
• All persons who did not have a job at all during the survey week, made specific active efforts to find a
job during the prior 4 weeks, and were available for work (unless temporarily ill).
• All persons who were not working and were waiting to be called back to a job from which they had
been laid off need not be looking for work to be classified as unemployed.

Excerpted from U.S. Department of Labor Bureau of Labor Statistics web site http://www.bls.gov/cps/cps_htgm.htm “How the Government Measures Unemployment.”


_________________________________________________________

Worksheet 11A, page 2

Exercise: After reading the textbook chapter, match the correct definition and characteristic with the 
type. Fill in the number of the type before its definition and characteristic


1. Choose five people you know and classify them as employed or unemployed. Explain.
• If unemployed, what type of unemployment are they experiencing?
• If employed, are they susceptible to being unemployed in the near future?

2. Research the fastest-growing jobs/industries.

______________________________________________________

Worksheet 11B

The Fed Today: Understanding Inflation

DEFINITION AND CAUSES OF INFLATION:
• Inflation is defined as a rise in the general level of prices over a sustained period of time.
• Inflation can be caused by too many dollars chasing too few goods (demand-pull).
• Inflation can be caused by increased costs of making and selling goods (cost-push).
• Inflation is often measured by the Consumer Price Index (CPI).


HARMFUL EFFECTS OF RAPID INFLATION:
• Inflation decreases consumers’ spending power when their incomes don’t rise as rapidly as the overall
price level.
• Inflation may cause lenders to lose money because they may be repaid with dollars that have less
value than when they first made their loans.
• Inflation causes savers to lose money because a dollar they save today will have less value in the
future when it is spent.
• Inflation makes it harder for businesses to plan, which may reduce investment in future projects.
• Inflation causes owners of financial assets to suffer when those assets don’t increase in value as much
as price levels rise.
• Interest-rate-sensitive industries, such as mortgage lenders, may suffer as inflation drives up longterm
interest rates, and Federal Reserve tightening raises short-term rates.
• At a national level, monetary policy, designed to slow inflation, typically results in lost output and
employment in the short run.

______________________________________________________________

Worksheet 11B, page 2

How Inflation Changes Individual and Business Decisions

The Consumer Price Index (CPI) is the number used to calculate percentage changes in the average level
of prices for a basket of goods and services purchased by a typical urban family. The categories below
show some of the major components of consumer spending and indicate how the price level for the
overall CPI and these components changed on an annual basis from 1971 to 1981. The data suggest that
the overall inflation rate was at its highest level in 1980. On an annual basis for the components of the
CPI, the fastest annual increase was recorded for gasoline in 1980. (By contrast, in 1971, the slowest
annual increase was recorded for gasoline.)

________________________________________________


Monday, November 22, 2010

Extra Credit to those who stayed after for the business plan.

Carpe Diem Advertising
Bess, Thaddaeus
Buksh, Bibi
Drenica, Lendita
Henley, Kenneth
Martinez, Arlyn
Medina, Maxiell

Cafe Impressa
Dela Cruz, Jon Carlos
Perez, Ruth
Timal, Geeta
Espinal, Frankely
Lakhi, Zainab
Cisse, Lica

LESSON 10: THE BUSINESS CYCLE

  Focus Question: To what extent can businesses avoid being hurt by downturns in the
business cycle?


Objectives
Students will be able to:
• Describe the different phases of the business cycle.
• Examine the suggested causes of business cycle fluctuations.
• Discuss the means by which the government uses fiscal policy to combat the harmful effects of the
business cycle.

Standards
NES: 18, 19, 20
ELA: 1, 3

Time Frame/Notes to Teacher
One day, double period
Worksheet 10B – Answer Key for Teacher:


Materials
Textbook chapter on: “Business Fluctuations.”

Teaching Strategies
I. Business Cycle
Review Worksheet 10A, “Business Cycle,” which the students have completed for homework. For
the introductory whole-class discussion, have students explain their answers to the following:
— What do we learn about the business cycle from this chart?
— Using this chart, how would you explain the business cycle to someone who knew nothing
about it?

— How would an understanding of the business cycle help you run your VE firm?
— To what extent can businesses help protect themselves from downturns in the business cycle?
— What questions does studying this chart raise?

II. Business Cycles and Economic Indicators
Distribute Worksheet 10B, “Business Cycles and Economic Indicators.” Divide students into groups
of four. Assign each group one phase of the business cycle. Have each group complete the exercise
on the worksheet; then have them explain their answers to the following:
— Describe the phase of the business cycle you read about.
— How can you explain the name give to each of these phases (i.e., “expansion,” “peak,”
“recession,” “trough”)?
— How well would our VE business do during each of these phases of the business cycle?
— What kinds of businesses would do better than others in downturns in the business cycle?
— Are businesses themselves most to blame for business cycles?

III. Causes of Business Cycles
Distribute Worksheet 10C, “Causes of Business Cycles.” Assign one student each to the following
roles: VE President, VE Vice President, VE Treasurer, VE Secretary, Dr. Talman, Dr. Jones, Dr.
Lukas, and Dr. Winters. After students act out the play, have the class explain their answers to the
following:
— Describe one cause of business cycles according to economists in this play.
— What are some conclusions about the business cycle that you can draw from listening to this
play?
— Which is the most important cause of the business cycle?
— Suggest an action that government or business can take to prevent the harmful changes in the
business cycle.

Summary/Assessment
Assume that interest rates are beginning to rise, the number of hours worked per week is going up, and
there is an increase in the number of new building permits. What would these indicators say about the
economy? Explain your answer.

How might the psychological strains that many people feel during difficult economic times help prolong
an economic downturn? Provide specific examples.

Homework
• Read materials in preparation for Lesson 11.
• Assign questions for homework.
• Have the students research the latest CPI and unemployment figures. Ask the following questions:
— From your study of economic indicators, in what direction do you think the economy is going?
— Do you think government should attempt to modify this direction? Why or why not?


                                                                   Business Cycle
                                Study the chart below, then complete the following exercise.


Exercise. Write a brief description, based on what you see in the chart above, of the following phases of the business cycle:
1. Trough:


2. Expansion:


3. Peak:


4. Recession:


Worksheet 10B
                                          Business Cycles and Economic Indicators
Exercise. Be prepared to give a one-minute talk describing conditions in the phase of the business
cycle you were assigned to study.


Worksheet 10C
                                                       Causes of Business Cycles
Assume that your VE leadership team was interested in learning more about business cycles, specifically
what causes them. You bring in four economists to speak about their ideas about the causes of the
business cycle.

VE President:           Ladies and gentlemen, thanks for coming here today. We are interested in
                                learning more about what causes business cycles. Having this knowledge,
                                perhaps we can avoid their most harmful effects. Dr. Talman, will you start,
                                please?
Dr. Talman:            I believe that you, the business leaders of this country, cause business cycles by
                               either investing or not investing in capital goods. Let me explain. Good
                               economic times come about when you people, expecting strong future sales,
                               purchase large amounts of new equipment and machinery or build or expand
                               your plants. These investments lead your businesses to produce more, resulting
                               in a stronger economy. However, after a while you stop spending on capital
                               goods. These cutbacks lead to recessions.

VE Vice President:    Dr. Jonas, do you agree with Dr. Talman?
Dr. Jonas:                I have focused my studies on inventory adjustments. Quite often, your
                                 businesses start building inventories at the first sign of an upturn and start cutting
                                 back inventories when you think there will be a downturn. It’s these
                                 readjustments in inventories that lead to recessions and expansions.
VE Treasurer:          We are eager to hear your views on the issue, Dr. Lukas.
Dr. Lukas:             It’s the commercial banks and the Federal Reserve that lead to changes in the
                               business cycle. When the Fed lowers interest rates and loans are easy to get, that
                               stimulates the economy. Generally, when the economy really gets going the Fed
                                raises interest rates. This eventually leads to less borrowing and eventually the
                                economy slows down.
VE Secretary:         Finally, Dr. Winters. What’s your thinking on the issue?
Dr. Winters:         I think my colleagues have overlooked the effects of external shocks to our
                             economy. By that I mean actions that create sudden problems for the economy, like
                             increases in oil prices or wars. Not all shocks are bad for the economy. For
                             example, the unexpected discovery of huge amounts of a resource like natural gas
                             or oil can lead to an economic boom.

LESSON 9: ECONOMIC INDICATORS

 LESSON 9: ECONOMIC INDICATORS
Focus Question: How can we tell the present and future state of the economy?
Objectives
Students will be able to:
• Discuss the value of leading, coincident, and lagging indicators in determining the existing and future
state of the economy.
• Describe examples of leading, coincident, and lagging indicators.
• Evaluate the reliability of certain leading, coincident, and lagging indicators.
• Draw conclusions about the current economic situation after analyzing a sampling of indicators.
• Gather the kind of data used to put together the CPI, a major lagging indicator.

Standards
NES: 12, 15, 18, 19, 20
ELA: 1, 3

Time Frame/Notes to Teacher
One day, double period
Materials
Textbook chapter on: “Measuring the Economy’s Performance.”

Teaching Strategies
I. It’s the Economy:
Review homework given prior to this lesson, (Worksheet 9A, “It’s the Economy”). As part of the
introductory discussion to this lesson, have students explain their answers to the following:
— What were the answers you received to questions 1-6?
— What conclusions can we draw from the results of the survey you administered?
— What issues do the responses you received from this survey raise for discussion?

II. Economic Indicators:
Divide the class into three groups. Distribute a different one of the following worksheets to each
group:
• Worksheet 9B, “Leading Indicators”; 9C, “Coincident Indicators”; and 9D, “Lagging Indicators.”
• Have students complete the exercises on the worksheets. Then have them explain their answers
to the following.

A. Leading Indicators:
For the group that studied leading indicators:
— What did you learn about leading indicators from the ones that you studied?
— Why are the indicators you studied considered leading indicators?
— Based on the current readings of the leading indicators you studied, in which direction is
the economy going in the near future?

B. Coincident Indicators:

For the group that studied coincident indicators:
— What did you learn about coincident indicators from the ones that you studied?
— Why are the indicators you studied considered coincident indicators?
— Based on the current readings of the coincident indicators you studied, how well is the
economy doing at the present time?


C. Lagging Indicators
For the group that studied lagging indicators:
— What did you learn about lagging indicators from the ones that you studied?
— Why are the indicators you studied considered lagging indicators?
— Why do we study indicators that really show us where the economy has been in the recent
past?

III. Whole-Class Discussion
As part of the whole-class discussion, have students explain their answers to the following:
— How reliable are these indicators as a whole?
— Give some reasons why sometimes the economy does not behave the way the indicators say it
should.

Summary/Assessment
Review Worksheet 9E, “Constructing a Market Basket,” which was distributed in Lesson 1 and due for
Lesson 9. Have students complete the exercise on the worksheet as a follow-up homework assignment.
After the assignment is completed, have students explain their answers to the following:
• What was the total amount of your market basket in your base “year”?
• By how much did your price index change from week one to week four?
• How can you explain the change?
• To what extent is the method you used a reliable method of calculating whether or not and by how
much prices have changed? What are some of the shortcomings of using this method to determine the
overall level of prices?

Homework
• Read materials in preparation for Lesson 10.
• Assign questions for homework.
• Complete Worksheet 10A before next lesson.

______________________________________________________________________________

Worksheet 9A
It’s the Economy
Exercise. Ask five adults to answer all of these questions:
1. How well would you say the U.S. economy is doing at the present time?
a) great
b) good
c) fair
d) poor

2. Give two examples that you can point to that would support the answer you gave in Question 1.

________________________________________________________________________

________________________________________________________________________

3. How important are each of the following in determining how well the economy is doing?

The direction in which the stock market is going.
a) very important
b) somewhat important
c) of little importance
d) not important

The number of people unemployed.
a) very important
b) somewhat important
c) of little importance
d) not important

The amount of goods and services produced in a given period of time.
a) very important
b) somewhat important
c) of little importance
d) not important

4. Of the three factors mentioned in Question 3 above, which is most important in determining how well
the economy is doing?
a) the Stock Market averages
b) the number of people unemployed
c) the amount of goods and services produced in a given period of time

______________________________________________________________

Worksheet 9B

Leading Indicators

Leading indicators measure aspects of the economy that tend to go up before expansions and down
before recessions.

Exercise. Read the worksheet below and access the listed links online. Then answer the following
questions in your notebook:


• What do the two indicators on this page measure?
• Why are these indicators considered important in judging the health of the economy?
• Do the most recent measures of these indicators tell us that the economy is healthy or unhealthy?
Explain.

Definition: One of several indices designed to measure changes in price of a broad array of stocks.

Source: Compiled by Standard & Poor’s. Available in most major newspapers and several
online market information sources.

Frequency: Daily through newspapers; instantaneous through online information sources.

Reason: The stock market is one measure of the current value of the nation's stock of capital and is
often viewed as a barometer of business and consumer confidence regarding the future. A high and/or
rising stock market may signal robust growth of business investment and consumer spending in the
near future, while a low and/or falling stock market may signal sluggish spending. For this reason, the
S&P 500 is one component of the Index of Leading Indicators.

View Chart: http://www.newyorkfed.org/rmaghome/dirchrts/pi_5.pdf

Definition: One measure of the nation's supply of money, defined as M1 (currency in circulation, demand
deposits, travelers' checks, and other checkable deposits) plus non-institutional money market funds and
small time and savings deposits.

Source: Board of Governors of the Federal Reserve System

Frequency: Weekly and monthly.
Availability: H.6 report. Weekly data released each Thursday afternoon after 4:30 p.m. Monthly data
released in either the second or third week of the month.

Reason: While the strength of the relationship has weakened over time, many people believe there is a
link
between growth of the supply of money and growth of nominal GDP.

View Chart: http://www.newyorkfed.org/rmaghome/dirchrts/pi_1.pdf

_______________________________________________________________________

Worksheet 9C

Coincident Indicators

Coincident indicators measure how well the economy is doing at the present time. Economists use these
indicators to help determine us to determine the phase of the business cycle we are in.

Exercise. Read the worksheet below and access the listed links online. Then answer the following
questions in your notebook:


• What do the two indicators on this page measure?
• Why are these indicators considered important in judging the health of the economy?
• Do the most recent measures of these indicators tell us that the economy is healthy or unhealthy?
Explain.

Definition: An estimate of the number of payroll jobs at all nonfarm business establishments and
government agencies. Information is also provided on the average number of hours worked per week
and average hourly and weekly earnings.

Source: U.S. Department of Labor; Bureau of Labor Statistics

Frequency: Monthly

Availability: Usually the first Friday of the month for the immediately preceding month;
occasionally released on the second Friday.

Reason: Growth of employment and hours worked provide important information about the current
and likely future pace of overall economic growth. Trends in average hourly earnings provide
information about supply and demand conditions in labor markets, which may provide signals about
the overall level of resource utilization in the economy.

View chart: http://www.newyorkfed.org/rmaghome/dirchrts/pi_8.pdf


Definition: An index designed to measure changes in the level of output in the industrial sector of
the economy. The index is grouped by both products (consumer goods, business equipment,
intermediate goods, and materials) and industry (manufacturing, mining, and utilities).

Source: Board of Governors of the Federal Reserve System

Frequency: Monthly

Availability: Preliminary estimate released around the middle of the month for the immediately
preceding month.

Reason: While the industrial sector of the economy represents only about 20 percent of GDP,
because changes in GDP are heavily concentrated in the industrial sector changes in this index
provide useful information on the current growth of GDP. The level of capacity utilization in the
industrial sector provides information on the overall level of resource utilization in the economy,
which may in turn provide information on the likely future course of inflation.

View chart: http://www.newyorkfed.org/rmaghome/dirchrts/pi_3.pdf
_______________________________________________________________
Worksheet 9D


Lagging Indicators

These measures of the economy are among the last to turn upward in a business expansion and the last to turn downward during a recession.

Exercise: Read the worksheet below and access the listed links online. Then answer the following questions in your notebook:

• What do the two indicators on this page measure?
• Why are these indicators considered important in judging the health of the economy?
• Do the most recent measures of these indicators tell us that the economy is healthy or unhealthy? Explain


Definition: The inventory to sales ratio looks at business investment in inventory in relation to monthly
sales. The inventory to sales ratio is calculated by dividing inventory balances at the end of any month by total sales for the same month.

Source: U.S. Department of Commerce; Bureau of the Census

Frequency: Monthly

Availability: About six weeks from the end of a month; for example, data for June are reported in
mid-August.

Reason: The inventory-to-sales ratio can serve as a quick and easy way to look at recent changes in
inventory levels, since it uses monthly sales and inventory information. This ratio will help predict early
cash flow problems related to a business's inventory. When the ratio begins to get lower after a recession it is generally good news for the economy because it means that items are being sold almost as soon as they are on the shelves. In an economic down turn items stay on the shelf (in inventory), rather than being] sold, for a relatively longer period of time. Very often the economy turns up before the inventory to sales ratio starts going down and the economy turns down before the ratio begins to go up. Thus, it is called a lagging indicator.

View chart: http://www.marketvector.com/leading-indicator/inventory-to-sales.htm


Definition: The inventory to sales ratio looks at business investment in inventory in relation to monthly
sales. The inventory to sales ratio is calculated by dividing inventory balances at the end of any month by total sales for the same month.
Source: U.S. Department of Commerce; Bureau of the Census

Frequency: MonthlyAvailability: About six weeks from the end of a month; for example, data for June are reported in mid-August.

Reason: The inventory-to-sales ratio can serve as a quick and easy way to look at recent changes in
inventory levels, since it uses monthly sales and inventory information. This ratio will help predict early
cash flow problems related to a business's inventory. When the ratio begins to get lower after a recession it is generally good news for the economy because it means that items are being sold almost as soon as they are on the shelves. In an economic down turn items stay on the shelf (in inventory), rather than being sold, for a relatively longer period of time. Very often the economy turns up before the inventory to sales ratio starts going down and the economy turns down before the ratio begins to go up. Thus, it is called a lagging indicator.

View chart: http://www.marketvector.com/leading-indicator/inventory-to-sales.htm

Definition: An index designed to measure the change in price of a fixed market basket of goods and
services. The market basket of goods and services is representative of the purchases of a typical
urban consumer. The index is intended to measure pure price change only; attempts are made to
remove changes in price resulting from changes in quality.

Source: U.S. Department of Labor; Bureau of Labor Statistics

Frequency: Monthly

Availability: Generally available the second week of the month immediately following the month
for which data is being released; always released after the Producer Price Index.

Reason: The rate of change of the CPI is one of the key measures of inflation for the U.S.
economy. Acceleration or deceleration of inflation may signal that a change in monetary policy may
be appropriate.

View chart: http://www.newyorkfed.org/rmaghome/dirchrts/pi_7.pdf

________________________________________________________________

Worksheet 9E

Constructing a Market Basket

Exercise. In this exercise you will learn about how one of the most important indicators, the
Consumer Price Index is compiled. For this exercise you will need the following tools:
• notebook
• pencil
• calculator

Follow the procedures below:

• Survey 10 students to see what kinds of food their families eat the most.

• Based on the survey, identify the five categories of food (e.g., bread, meat, pasta, etc.) that are
purchased most often.

• Go to a local supermarket. Identify three specific brands of the same size within each of the five food

categories (e.g., one pound of X’s, one pound of Y’s, and one pound of Z’s butter).
• Price each specific item on a per week basis for one month. You must price the same products in the

same supermarket on the same day each week.
• After the first week add up the total amount in prices of the 15 items in your market basket. Use this
number to serve as your base “year.”

• After visiting the supermarket at the end of weeks two, three, and four, total the amount of your
market basket again, and compare the totals to that of your base “year.”

• Construct a price index by following these instructions:
— List your market basket content. (Include brand names and quantities.)
— Give week one, your base “year,” a value of 100.
— Calculate index numbers for weeks 2, 3, and 4 by dividing the total amount for the 15 items for
each week by the total of the 15 items for the first week.

• To calculate the percentage change for weeks 2, 3, and 4, subtract 100 from the index number for
each week. For example, if the total amount of the 15 items for the first week totaled $75 and the total
for the second week was $90, then the index number for the second week was $90/$75 = 1.2 x 100 =
120. The percentage change in prices from week one to week two is 120 (index number for the
second week) – 100 (index number from the first week) = 20%


Tuesday, November 16, 2010

Carpe Diem Business Plan Checklist

INTRODUCTORY COMPONENTS (10%)

  • Cover Page
    • name of business
    • logo
    • data
  • Table of Contents
    • each major section
    • page numbers
    • organized & neat
  • Executive Summary
    • Summarize the entire plan
  • Company Description
    • Organization date
    • industry
    • legal description 
    • location
    • brief history  
  • Mission Statement
    • Represents what the company stands for
MARKETING PLAN (30% total)
Assessment of the Environment

  • Current Economic Conditions:
    • employee levels 
    • interest rates 
    • rate of inflation/deflation
    • rate of change of GDP
    • balance of trade
    • exchange rates   
  • Industry analysis - real & virtual
    • Real: Demonstrates a real understanding of the real world industry 
    • Virtual: Provide evidence that research was done to obtain information about the virtual company
  • Target market & market segmentation:
    • target consumer group 
    • separates layers of marketing 
  • Competitive analysis: 
    • examination of competing firms 
THE MARKETING MIX 12%

  • Product 
    • features that will satisfy customer needs 
  • Price
    • demand based
    • cost based
    • competition based
  • Placement 
    •  trade fairs 
    • web based 
    • non-virtual customers 
  • Promotion 
    • benefits for doing business with your company
  • Positioning
    • image created in the customers mind 
BREAK-EVEN ANALYSIS 6%

    • Provide details about assumptions you used to perform analysis 
MANAGEMENT FUNCTIONS 20%

  • Planning
    • business goals & objectives 
  • Organization
    • organized to be able to meet objectives 
  • Direction 
  • Controlling 
    • compare expected results with actual outcomes 
FINANCIAL DATA 25%

  • Income Statement 
    • statement for a fiscal year with details  
  • Balance sheet
    • reporting date (10/31/2010-4/30/2011
  • Cash flow statement
    • payments and reciets
SWOT ANALYSIS & DISCUSSION OF BUSINESS RISKS 10%
  • swot analysis
    • Distinguishing between internal & external
  • discussion of bunsiness risks
    • incorrect assumptions
    • strategy for dealing with risks identified
PRESENTATION OF PLAN 5%
  • well designed
Appendix

  •   Existing firms
    • balance of accounts
  • All firms
    • non virtual entries
    • Loan amortization table for loans

Cafe Impresa Business Plan Checklist

INTRODUCTORY COMPONENTS (10%)

  • Cover Page- Rodney DONE (needs to be attached)
    • name of business
    • logo
    • data
  • Table of Contents Ruth
    • each major section
    • page numbers
    • organized & neat
  • Executive Summary- Ruth
    • Summarize the entire plan
  • Company Description Ruth
    • Organization date
    • industry
    • legal description 
    • location
    • brief history
    • Current Status and future Goals- Natasha Needs to be done  
  • Mission Statement
    • Represents what the company stands for


DESCRIPTION OF STAFFING (Marjohn and Saqlain) NOT DONE
    • all staff
MARKETING PLAN (30% total) (Needs to be completed Stefano)
Assessment of the Environment

THE MARKETING MIX 12% (Mikey Nunez Needs to be redone!)

  • Product 
    • features that will satisfy customer needs 
  • Price
    • demand based
    • cost based
    • competition based
  • Placement 
    •  trade fairs 
    • web based 
    • non-virtual customers 
  • Promotion (Not done reword Shamara Overton, Jhane Miller)
    • benefits for doing business with your company
  • Positioning
    • image created in the customers mind 
BREAK-EVEN ANALYSIS 6%

    • Provide details about assumptions you used to perform analysis 
MANAGEMENT FUNCTIONS 20%

  • Planning
    • business goals & objectives 
  • Organization
    • organized to be able to meet objectives 
  • Direction 
  • Controlling 
    • compare expected results with actual outcomes 
FINANCIAL DATA 25%

  • Income Statement 
    • statement for a fiscal year with details  
  • Balance sheet
    • reporting date (10/31/2010-4/30/2011
  • Cash flow statement
    • payments and reciets
SWOT ANALYSIS & DISCUSSION OF BUSINESS RISKS 10%
  • swot analysis  (DONE Crystal Nunez)
    • Distinguishing between internal & external
  • discussion of bunsiness risks (not done Frankely)
    • incorrect assumptions
    • strategy for dealing with risks identified
PRESENTATION OF PLAN 5%
  • well designed
Appendix
  •   

LESSON 8: THE ROLE OF GOVERNMENT

Focus Question: How much should government be involved in the economy?


Objectives


Students will be able to:
• List some of services performed by government in their local communities.
• Examine the roles played by different levels of government in our economy.
• Determine to what extent businesses are better off with a government that is more involved, as
opposed to a government that is less involved in the economy.
• Analyze arguments supporting and opposing government playing a more active role in the economy.

Standards
NES: 16, 17, 18, 20
ELA: 1, 2, 3

Time Frame/Notes to Teacher
One day, double period

Materials/Instructions
Textbook chapter on “Government and the Economy.”

Teaching Strategies
I.  Government Services List:
Distribute Worksheet 8A, “Government Services List.” Have students complete the exercise on the
worksheet. As part of the whole-class introductory discussion to this lesson, have students explain
their answers to the following:
— Which of your neighborhood services does government perform?
— Which services do you think should be performed by the private sector? Explain.
— What questions does this worksheet raise for our class discussion?

II. Government Services Chart:
Distribute Worksheet 8B, “Government Services Chart.” Have students complete the exercise on the
worksheet, then have explain their answers to the following:
— What conclusions can you draw from looking at the chart about the role government plays in our
economy?
— Which services do you think government should perform? Explain.
— Which services do you think the private sector could perform better? Explain.

III. Business and Government
Distribute Worksheet 8C, “Business and Government.” Have students complete the exercise on the
worksheet. Then have them explain their answers to the following:
— What is this chart showing us? (Use your own words to explain.)
— What does this chart show us about the relationship between business and government?
— Do you think that Americans are better off if businesses are taxed as much as possible or as little
as possible?


IV. Points of View: The Role of Government
Distribute Worksheet 8D, “Points of View: The Role of Government.” Have students complete the
exercise on the worksheet, then have them explain their answers to the following:
— In your own words, summarize Speaker A’s arguments.
— What did Speaker A mean when he said, “Outside of its legitimate function, government does
nothing as well or as economically as the private sector”? Do you agree?
— In your own words, summarize Speaker B’s arguments.
— What did Speaker B mean when he said, “We are all better off because of what government
does”? Do you agree?
— Which speaker do you agree with more?

Summary/Assessment
• Identify two instances in which you have personally benefited from government regulations. Explain
the benefits.
• To what extent do you think government should be involved in a free enterprise economy? Defend
your answer.

Homework
• Read materials in preparation for Lesson 9.
• Assign questions for homework.
• Complete Worksheet 9A for next lesson


Worksheet 8A
                                        Services Provided By Government


Exercise: Walk around your neighborhood. In Column 1 below, list as many services as you can find
that are performed (paid for) by the local, state, or federal government. In Column 2, place a check in
the box A or B below to indicate whether you believe that that service should be performed by
government or by the private sector.


Worksheet 8B
                                                        Government Services Chart


Exercise: The chart below illustrates a number of the services that are performed by local, state, or
federal government. Circle any picture representing a service that you think would be better performed by the private sector. Be prepared to explain your answers.


James Killoran, Economics and You (New York: Amsco, 1991), p. 164. Permission pending.


Worksheet 8C
                                                      Business and Government
Study the chart below and complete the exercise that follows:

                           RELATIONSHIP BETWEEN BUSINESS AND GOVERNMENT


Exercise: The boxes labeled A, B, C, and D above show four ways that business and government
interact in our economy. One example of each of those four relationships appears below. Place the
correct letter of the type of relationship in front of each of the examples. Each letter should appear only once.
_____ 1. Local contracting firms are hired to construct government buildings, such as a new
courthouse, or to build local roads and bridges.

_____ 2. Businesses receive revenues from government to build weapons for the armed services.

_____ 3. Businesses pay income taxes on their profits to the federal, state, and local governments.

_____ 4. Governments provide public goods and services that facilitate business operations, such as fire and police protection, roads, and the legal system.


Worksheet 8D
                                                 Points of View: The Role of Government
Exercise: Speakers A and B disagree over the proper role of government in our economy. Circle the
sentence from each speaker’s statement that contains the strongest argument supporting his or her
point of view.


Tuesday, November 9, 2010

Carpe Diem Business Plan Responsibilities

Click HERE to view Carpe Diem Advertising Written Business Plan 2010-2011
https://docs.google.com/Doc?docid=0AemNPtMkYmcTZGZ2Mjg1NjVfNGdrZ2p3bmc2&hl=en


Log in to your GMail account and click on Documents to Edit . .


To view CARPE DIEM ADVERTISING BUSINESS PLAN 2009-10 click:
https://docs.google.com/fileview?id=0B-mNPtMkYmcTNjZiZmFlNTMtZmRjNi00ZmM1LTkxMWYtMWQwN2RjNTk1Nzdi&hl=en


https://docs.google.com/Doc?docid=0AemNPtMkYmcTZGZ2Mjg1NjVfNGdrZ2p3bmc2&hl=en


FINANCIAL DOCUMENTS for CARPE DIEM ADVERTISING 2009-10 can be found HERE:
http://dwcvirtualenterprise.blogspot.com/2010/05/important-information-for-financial.html

Of particular importance is CARPE DIEM FINANCIAL STATEMENTS WORKSHEET - to EDIT, ask Thaddaeus or Kenneth 


CARPE DIEM ADVERTISING WRITTEN BUSINESS PLAN 2010 - 2011 ASSIGNMENTS


Cover Layout


Letter From CEO -  Thaddaeus Bess Junior


Table of Contents


Introductory Content - Thaddaeus Bess Junior
 Statements of purpose - Thaddaeus Bess Junior
Mission statement - , Mary Nnamani
Business objectives - Thaddaeus Bess Junior
Company description - Kenneth Henley
Current Status - Tsian Haywood
Future Goals - Human Resources
Description of staffing - Zaire Snidercorbett
 Organizational Chart - Jonathan Espinosa


 Market Analysis - Lendita Drencia
Real World Industry Analysis Lendita Drencia
Virtual Enterprise Industry Analysis - Lendita Drencia
Components of the Marketing Mix - Lendita Drencia
Target Market - Lendita Drencia
Market Segmentation - Lendita Drencia


SWOT Analysis - Bibi Buksh
Internal Audit - Bibi Buksh
External Audit - Bibi Buksh
Discussion of Business Risk - Bibi Buksh


Operating Procedures - Sashey Pimentel
Location - Sashey Pimentel
Process - Sashey Pimental


Financial Data - Maxielle Medina
Balance Sheet - Arlyn Martinez
Projections to support the plan - Arlyn Martinez
3 year projected income statement - Arlyn Martinez
1 year projected cash flow statement - Maxielle Medina
Break even analysis - Arlyn Martinez
Explanation of Financials - Maxielle Medina


Baez, Anelys-Future Goals
Bess, Thaddaeus - Statements of purpose, Mission statement, Business objectives, Company description
Buksh, Bibi - SWOT Analysis, Internal Audit 
Burgos, Eberardo
Drenica, Lendita - Real World Industry Analysis  
Dykes, Asha-Organizational Chart 
Edmonds, Cadashia-Components of the Marketing Mix,Virtual Enterprise Industry Analysis 
Elliot, Ashley-Future Goals
Espinoza, Jonathan-Organizational Chart 
Fabian, Stephanie-Company description
Gonzalez, Alcides-Market Segmentation
Haywood, Tsian-Current Status 
Henley, Kenneth-Company description
Khalil, Saad-Target Market
Martinez, Arlyn - Balance Sheet, Projections to support the plan, Break even analysis
Martinez, Jean-3 year projected income statement,
Medina, Maxiell - Financial Data, 1 year projected cash flow statement, Explanation of Financials
Nnamani, Mary - Mission statement 
Pimentel, Sashey - Operating Procedures, Location
Ramirez, Kaitlin-Future Goals
Richards, Rumeale
Rodriguez, Jairo-External Audit
Sahai, Mahendra-Technical Operations
Snidercorbett, Zaire-Description of staffing 
Timal, Geeta - Proofreading
Valdez, Natasha-Process
Warrren, Dominique-Current Status